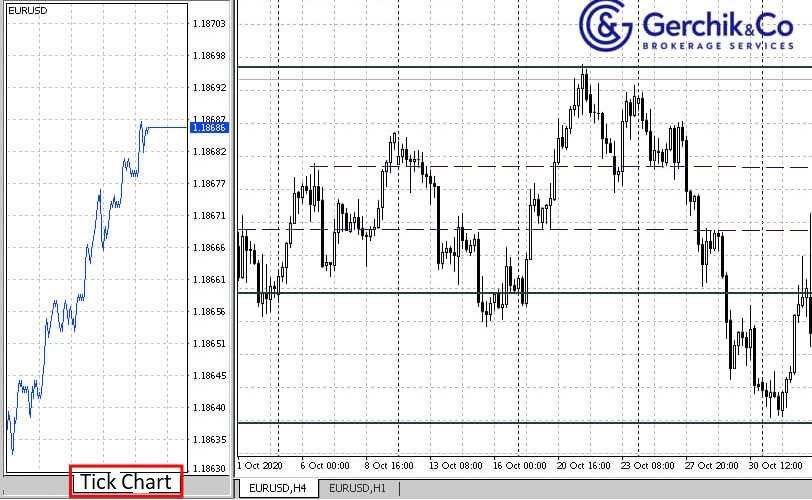
Tick trading implies the use of special charts that are not built the same way as the regular ones that include bars or candlesticks. It is typically used with scalping strategies where one trade can be several seconds long.
In today's article, we will get to the bottom of the tick chart trading and how to do it right.
1. Tick Strategy: Chart Nuances
2. Tick Trading in Forex: Terms and Conditions
3. Trading Tick Volumes
Essentially, the word "tick" means the minimum change in the price of an asset traded in the exchange. What’s interesting, neither the price movement direction nor the time in the course of which this change occurred, nor the number of pips traveled are factored in here.
NOTE:
All that matters is the very fact that price moved as a result of a trade made in the market. What traders see in the tick charts helps them to track down events occurring at a certain point in time.
In order to see the tick display, open the Market Watch window in the MetaTrader 4 or MetaTrader 5 terminal, hover the mouse cursor over your desired asset, and choose “Tick Chart” in the menu.
To use tick trading with scalping strategies, you need to be aware of the conditions offered by brokerage companies. These trades are opened and closed within several seconds, the profit made in each such trade is rather small but traders benefit from a large number of positions.
Open a trading account at Gerchik & Co
The estimation of volumes traded in forex is not an easy task since the market is decentralized and unanimous data are impossible to find. However, there is a way to see tick volumes. They reflect the number of trades and not the amount of money that has been spent on it. This data can be used to get a clear picture of what is happening in the market.
The easiest way to do that is to use the Volumes, a standard indicator for MetaTrader 4 and MetaTrader 5. You can find it in the “Volumes” tab of the indicator list. It will be shown as a bar graph in a separate window under the chart.
Trading based on a tick indicator allows understanding whether the market players’ interest in a particular asset has intensified or grown weaker. Volumes indicator can be used as an additional advisory tool to analyze the existing market situation.
1. If low volatility and growing candlestick are forming in the price chart, while the volumes are expanding based on the Volume indicator, these are the preconditions for the price growth.
2. When following this scenario the price starts growing against the backdrop of decreasing volumes, this signals a trend continuation. Now if the price is growing along with volumes, the movement in this direction may be short-lived.
3. Increasing volumes against the backdrop of low volatility and bearish candlesticks may point to the price drop. 4. If the price drops while the volumes continue to rise, this can be a short-term trend. If the price drop is accompanied by decreasing volumes, the trend may be long-term.